1. Lead market snapshot
According to LBMA, the precious metals market entered 2026 with still-strong momentum, but it also faces macro risks, interest-rate uncertainty, the U.S. dollar, central bank demand, and volatility. In an LBMA Alchemist article published on March 1, 2026, gold was described as receiving support from expectations of lower U.S. real rates, potential Fed easing, and central bank diversification away from the dollar.
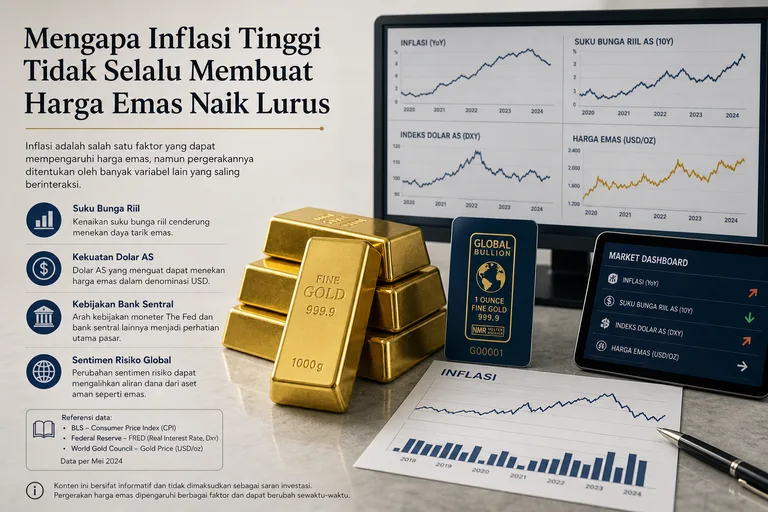
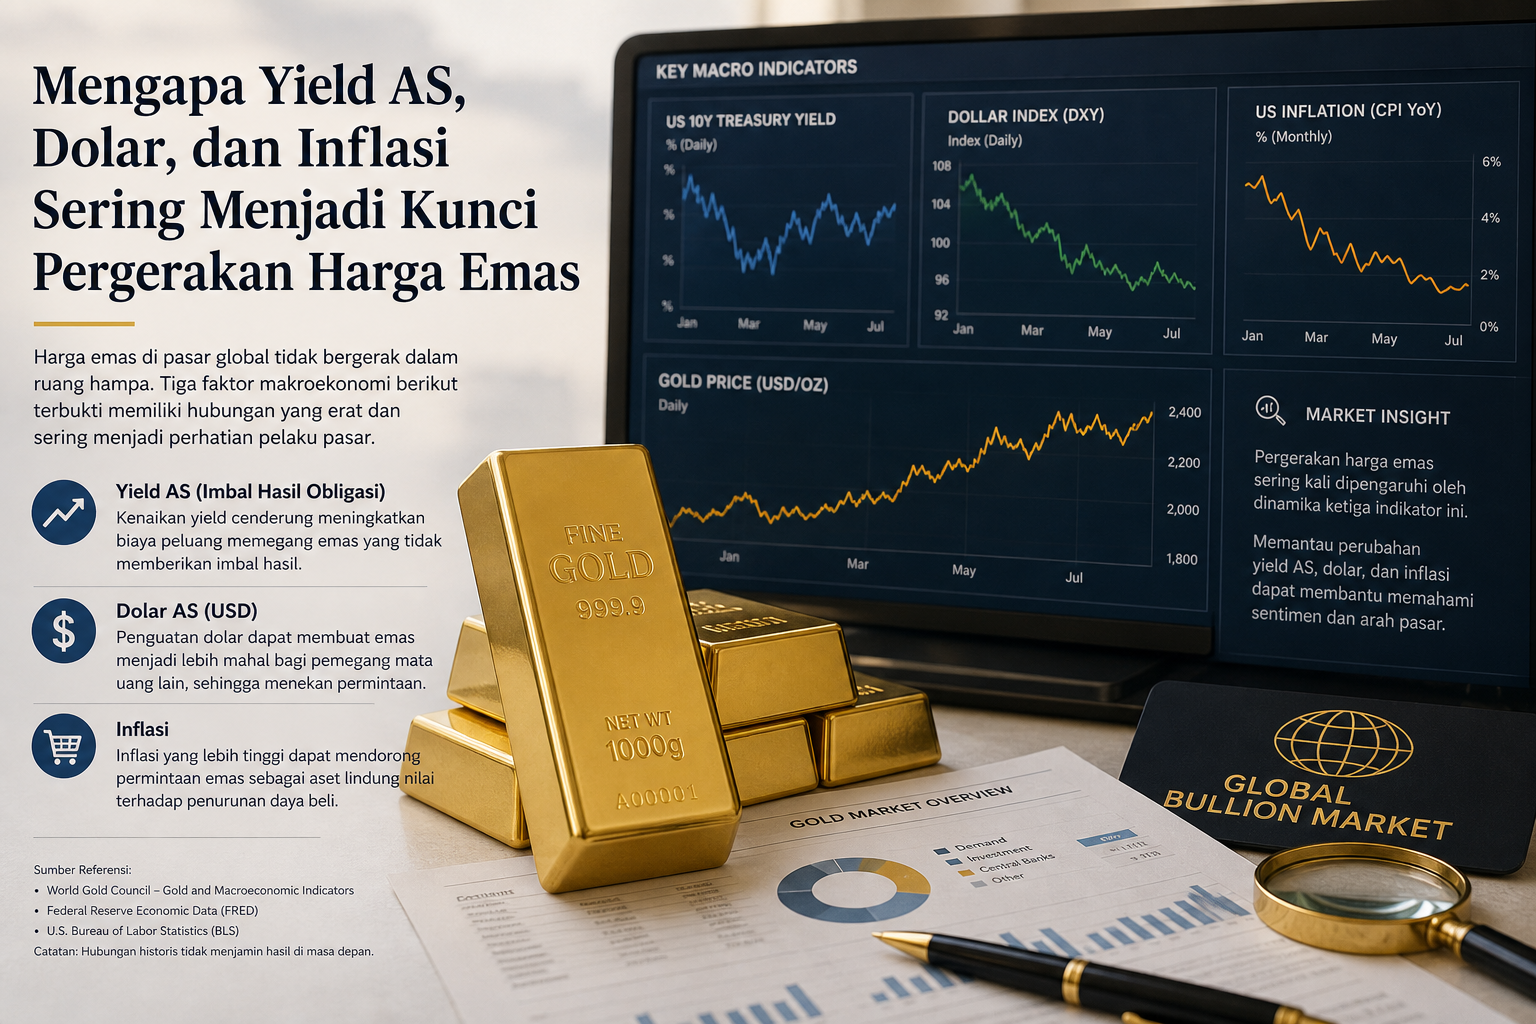
This context matters because gold prices are not read only from daily charts or retail price changes. For bullion, several macro indicators often form the main backdrop: the U.S. 10-year Treasury yield, the U.S. dollar index, inflation, and real yield. These four do not always move neatly in the same direction, but they often help explain why interest in gold may strengthen or soften over a given period.
This article is educational. No daily spot price, retail price, or buy-sell spread data is included in the market input for this cycle. For that reason, the discussion focuses on how to read the macro context available from public sources such as LBMA, Reuters via Kitco, and the Federal Reserve Bank of St. Louis FRED, rather than on a specific transaction level.
2. Price context and spread
Because no retail price, buyback price, current spot price, or transaction spread data was provided, this article does not conclude whether gold is expensive, cheap, or trading at a particular spread right now. That distinction matters. Macro moves can help explain the market backdrop, but pricing for physical products is also shaped by production costs, distribution, taxes, liquidity, brand, and each seller’s policy.
In other words, U.S. yields, the dollar, inflation, and real yield provide the broad context, not a substitute for checking actual prices. Readers following physical bullion still need to separate global reference pricing from local transaction pricing. Timing differences, exchange rates, product premiums, and buy-sell spreads can make the consumer experience different from the global market narrative.
A cleaner editorial approach is to separate two layers. The first is the global macro layer, such as the direction of yields, the dollar, inflation, and Fed policy. The second is the actual product price available in the local market. This article covers only the first layer because that is the data available in the external sources provided.
3. Main movers or strongest signal
Gold and the opportunity cost of holding a non-yielding asset
One reason U.S. yields are closely watched by gold market participants is the basic nature of bullion itself. Gold does not pay a coupon like a bond and does not offer dividends like a stock. Its value mainly comes from its role as a hedge, a store of value, a diversification instrument, and an asset often sought when uncertainty rises.
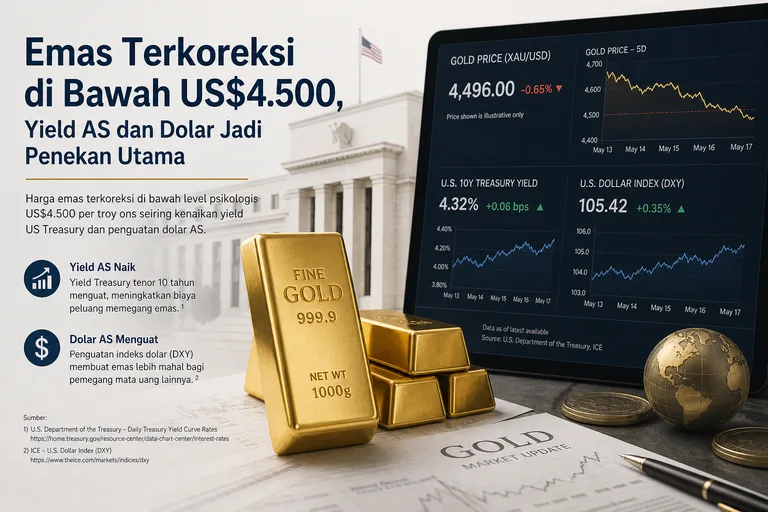
When U.S. government bond yields rise, especially the 10-year Treasury yield, global investors usually re-evaluate the set of assets available to them. U.S. government bonds offer nominal income, while gold does not. In that setting, the opportunity cost of holding gold can increase because there is an alternative asset that generates interest income.
Conversely, when yields fall or the market begins to expect easier policy, the opportunity cost of holding gold can decline. That does not automatically mean gold prices will rise, but lower-yield conditions are generally viewed as more supportive for bullion. That is why FRED data for the U.S. 10-year Treasury yield is widely used as a macro indicator when reading pressure or support for gold.
The relationship should not be read mechanically, however. Gold can remain strong even if nominal yields do not fall sharply, provided other factors also help, such as safe-haven demand, central bank buying, a weaker dollar, or rising inflation concerns. On the other hand, gold can weaken even when lower-rate narratives are in place, especially if the market has already priced that scenario in.
Why real yield matters more for gold
Beyond nominal yield, the gold market is often more sensitive to real yield. In simple terms, real yield is the return after taking inflation or inflation expectations into account. If nominal yields rise but inflation or inflation expectations are also high, the real appeal of bonds does not necessarily improve by as much as the headline number suggests.
For general readers, the easiest way to understand real yield is to ask: after inflation, how much return is actually left? If the answer is low, or even under pressure, gold can more easily retain its appeal as a store of value. If real yields rise sharply, gold may face pressure because interest-bearing assets become relatively more attractive.
LBMA, in the research signal available, highlighted lower U.S. real rates as one factor supporting gold. That is consistent with the opportunity-cost logic above. When the real return on interest-bearing instruments falls, gold’s main disadvantage as a non-yielding asset becomes smaller.
Still, real yield should not be treated as a single forecast tool. It is one lens for reading the market. Gold price changes are ultimately influenced by a combination of factors: central bank direction, risk sentiment, investment flows, physical demand, and the U.S. dollar.
The role of the U.S. dollar in bullion prices
Gold in global markets is generally priced in U.S. dollars. For that reason, moves in the dollar are closely linked to the purchasing power of non-U.S. buyers. When the dollar strengthens, gold priced in dollars can feel more expensive to buyers using other currencies. That can weigh on global demand, even if the effect does not appear immediately.
By contrast, a weaker dollar tends to make gold more accessible for non-U.S. buyers. FRED’s Nominal Broad U.S. Dollar Index is relevant here because it provides a broad view of the dollar’s strength against trading partners’ currencies. In external research that is available, a weaker dollar is also tied to reserve diversification and safe-haven demand narratives.
The gold-dollar relationship also has a market psychology dimension. When investors begin to question the direction of U.S. monetary policy, fiscal durability, or geopolitical stability, some capital can move toward assets seen as more neutral. In that context, gold is often viewed as part of diversification rather than simply as a commodity.
As with yields, the dollar does not act alone. A stronger dollar usually creates short-term pressure for gold, but gold can still hold up if safe-haven demand or central bank demand is strong enough. On the other hand, a weaker dollar can support gold, but it does not guarantee gains if risk appetite improves sharply and demand for defensive assets fades.
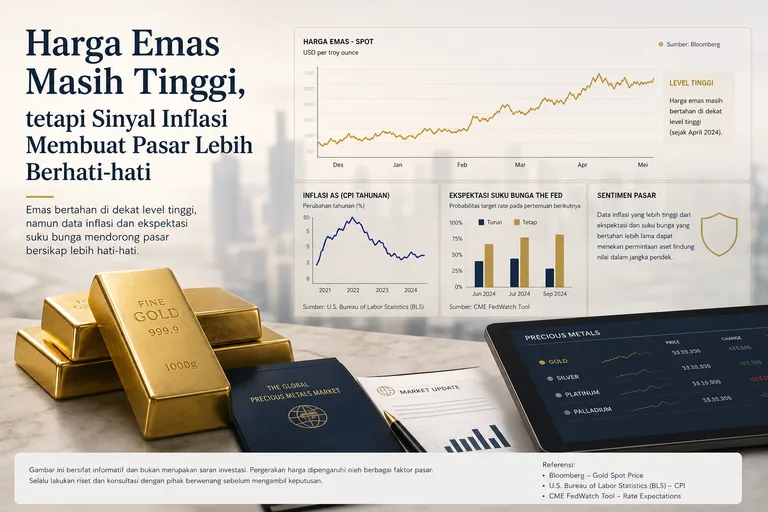
Inflation: supportive narrative, but not a straight line
Inflation is often cited as one reason people pay attention to gold. Historically, gold has been viewed as a store of value when a currency’s purchasing power comes under pressure. In modern markets, however, gold’s response to inflation is more complex because inflation also affects expectations for interest rates.
If inflation rises and the central bank is expected to respond by raising rates, nominal yields and real yields can move higher as well. In that environment, gold may face pressure even if the inflation-hedge narrative sounds positive. That is why professional investors do not look at inflation in isolation; they also read the central bank response and the direction of real yields.
Conversely, if inflation remains a concern while the market expects rates to fall or real yields to weaken, gold can receive stronger macro support. In other words, what matters is not just inflation, but the combination of inflation, yields, and monetary policy expectations.
The 2026 context highlighted by LBMA places expected Fed easing, lower real rates, and diversification away from the dollar within the supportive narrative for gold. This is not a statement that prices must move in one direction, but rather a sign that the bullion market is reading several macro signals at the same time.
Central banks and safe haven demand as an added layer
Beyond macro indicators such as yields and the dollar, central bank demand is another factor often discussed in the gold market. Reuters via Kitco reported on November 26, 2025, that Deutsche Bank raised its 2026 gold price forecast to US$4,450 per ounce, with a range of US$3,950 to US$4,950 per ounce. The supporting factors cited in that report included steady investment flows, persistent central bank demand, ETFs, and tight supply-demand conditions.
That figure should be read as one institution’s forecast, not as a guarantee. Forecasts can change if assumptions about the Fed, the dollar, inflation, or investment flows change. For sound market editorial, such data is useful as a sentiment reference, but it should not be treated as a promise of price direction.
Safe-haven demand is also an important layer. When geopolitical uncertainty or macro concern rises, gold often draws attention because it does not depend on the obligations of an issuer like a bond or a stock. But safe-haven status does not mean gold is immune to corrections. LBMA itself emphasizes that the precious metals market can remain volatile even when it has structural support.
That volatility should always be stated clearly. Gold can strengthen because yields fall, the dollar weakens, real yields decline, and safe-haven demand rises together. But gold can also fall if the dollar strengthens sharply, real yields rise, expectations for rate cuts fade, or traders take profit after a large move.
4. Editorial takeaway
The strongest signal in the available set is continued attention to central bank policy, especially the Fed, and its impact on real yields and the dollar. LBMA highlights expectations for lower rates and lower U.S. real rates as part of the support for gold. FRED provides the 10-year Treasury yield and the broad dollar index, which are widely used to read that backdrop.
If expectations for Fed easing strengthen, markets usually reprice the potential for lower yields and a weaker dollar. That environment can reduce the opportunity cost of holding gold. But if economic data leads investors to believe rates will stay higher for longer, real yields and the dollar can once again become a source of pressure.
That is why gold is often sensitive to U.S. data releases, comments from central bank officials, and shifts in rate expectations. Price reactions can be fast because markets are adjusting assumptions. But short-term reactions do not always match the medium-term trend, especially if physical demand and central bank buying remain supportive.
For readers, the main point is not to guess the next number. What is more useful is understanding the map of relationships: higher yields usually increase the opportunity cost of gold; a stronger dollar can reduce purchasing power for non-U.S. buyers; inflation affects rate expectations; and real yield combines yield and inflation into a measure that is more relevant for gold.
5. Reference reminder
Gold is often described as a simple asset, but its market context is not always simple. Bullion prices sit at the intersection of monetary policy, the dollar, inflation, safe-haven demand, and institutional buying. For that reason, no single indicator is enough to explain all price moves.
U.S. 10-year Treasury yields, the U.S. dollar index, inflation, and real yield should be treated as context-reading tools, not prediction machines. When these indicators move in the same direction in a way that supports gold, the bullish narrative can look stronger. When the signals are mixed, volatility and short-term reversals become more likely.
The main references for this context are LBMA for precious metals market surveys and analysis, Reuters via Kitco for Deutsche Bank’s institutional forecast, and FRED at the Federal Reserve Bank of St. Louis for U.S. 10-year Treasury yield data and the broad dollar index. With those references, the discussion of gold can remain factual, easy to verify, and free of personal investment advice.
In short, gold does not move on one headline alone. It moves within a network of interconnected signals. Understanding yields, the dollar, inflation, and real yield helps readers see why the bullion market can change quickly, while also reminding them that macro context is a guide to market reading, not a guarantee of price direction.
References
- LBMA (2026). LBMA 2026 Precious Metals Forecast Survey: emas dan perak diperkirakan tetap volatil dengan risiko kenaikan. Bullish secara struktural untuk emas karena survei menyoroti dukungan dari safe haven, diversifikasi cadangan, dan ekspektasi suku bunga lebih rendah; namun volatilitas tinggi berarti artikel perlu menekankan risiko pullback.
- LBMA (2026). LBMA Alchemist: momentum precious metals 2026 bertemu risiko makro yang meningkat. Memberi dasar kuat untuk angle bahwa emas masih mendapat dukungan makro dari real yield dan diversifikasi USD, sementara silver dapat menawarkan upside lebih besar tetapi dengan risiko volatilitas ekstrem.
- Reuters via Kitco (2025). Reuters via Kitco: Deutsche Bank menaikkan forecast emas 2026 ke $4.450/oz. Bullish untuk emas karena dukungan institusional dan bank sentral dipandang cukup kuat untuk menjaga harga tinggi; risiko editorial yang perlu dicatat adalah ekspektasi Fed yang bisa berubah.
- Federal Reserve Bank of St. Louis FRED (2026). FRED: U.S. 10-Year Treasury yield sebagai indikator opportunity cost emas. Netral hingga bullish jika yield turun atau ekspektasi pemangkasan suku bunga menguat; bearish jika yield riil naik dan USD ikut menguat.
- Federal Reserve Bank of St. Louis FRED (2026). FRED: Nominal Broad U.S. Dollar Index sebagai sinyal tekanan atau dukungan untuk emas. Bullish jika dolar melemah, terutama bila dikombinasikan dengan ekspektasi pemangkasan suku bunga; bearish jangka pendek jika dolar menguat tajam.
- LBMA (2026). LBMA analyst forecasts: silver 2026 dipandang sangat volatil karena peran moneter dan industrial. Bullish untuk silver saat emas menguat dan kondisi likuiditas longgar, tetapi risiko koreksi besar perlu ditekankan karena harga tinggi bisa menekan permintaan industri dan perhiasan.