1) Lead market snapshot
According to Trading Economics, annual U.S. inflation rose to 3.8% in April 2026 from 3.3% in March, above the 3.7% estimate. Core inflation also increased to 2.8%. For bullion readers, this keeps price pressure on the macro radar.
Gold is often discussed as a hedge when purchasing power weakens. But that relationship does not move in a straight line, and it does not automatically translate into a clean price advance.
2) Price context and spread
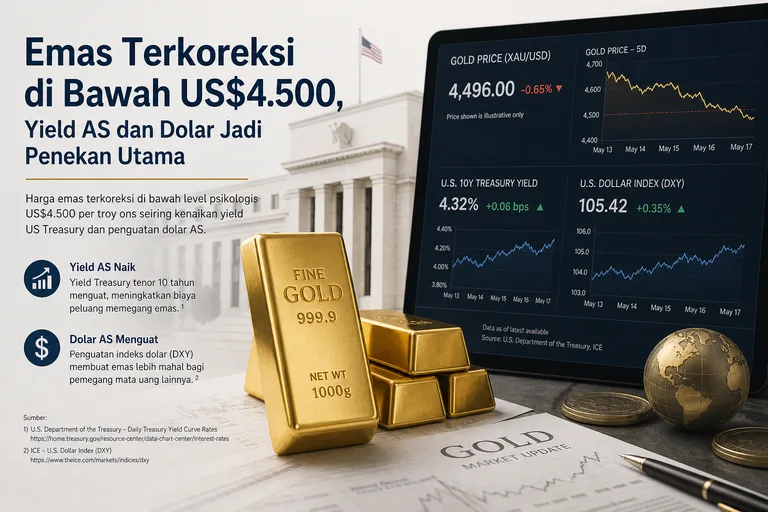
Kitco reported spot gold at around US$4,701.50 per ounce on May 14, 2026. In the same context, Kitco noted that gold had also faced pressure from hotter producer-price data, a stronger U.S. dollar, and Treasury yields around 4.5%, even as some safe-haven demand linked to geopolitical tensions remained.
This is why gold often appears to move on several layers at once. High inflation can strengthen the fundamental case for holding gold, but higher yields and interest rates can make income-bearing assets more attractive than an asset that does not pay interest.
3) Main movers or strongest signal
Inflation supports the hedge narrative, but it is not the only factor
In simple terms, high inflation means goods and services are rising in price more quickly. If inflation stays elevated, market participants often question the real value of cash and currency-based instruments. That is where gold often enters the discussion as a store of value.
But gold does not react only to current inflation. The market also reads what inflation means for central bank policy, especially the Federal Reserve. If inflation rises, expectations for rate cuts can be delayed, or the market may conclude that rates need to stay high for longer.
Trading Economics said the U.S. policy rate was 3.75% in May 2026. That matters for gold because interest rates affect opportunity cost, meaning the trade-off of holding an asset that does not earn income. When interest-bearing instruments still offer attractive returns, some investors may prefer them over gold, especially in the near term.
So high inflation does not automatically push gold higher in a straight line. Inflation can support the case for hedging, but the policy response to inflation can create opposing pressure. That is one reason gold often does not follow a simple “inflation up, gold up” pattern.
Yield is a key balancing factor
Kitco highlighted Treasury yields around 4.5% in the pressure on gold. That level shows that the bond market is still offering returns that matter. For gold, higher yields are often a headwind because gold does not pay coupons or interest.
When yields rise or stay elevated, the opportunity cost of holding gold also rises. Income-oriented investors may compare gold with instruments that provide periodic returns. In that setting, gold can still attract hedging demand, but price gains may be held back by the appeal of yield-bearing assets.
By contrast, if the market starts to price lower rates ahead, the opportunity-cost pressure on gold can ease. This article does not forecast the direction of rates or gold prices. The main point is that the gold market reads inflation together with yields, not in isolation.
That also helps explain why inflation headlines sometimes trigger price reactions that look counterintuitive. Hot inflation data can support gold’s hedge story, but it can also reinforce the view that rates must remain high. Those two signals can coexist and make price action look non-linear.
The U.S. dollar also shapes market comfort
Beyond inflation and yields, the U.S. dollar matters for global gold pricing because gold is usually traded in dollars. The Federal Reserve Bank of St. Louis, via FRED, said the Nominal Broad U.S. Dollar Index stood at 118.0392 on May 8, 2026, down from 118.8264 on May 4.
A weaker dollar usually makes gold relatively cheaper for non-U.S. buyers. In the global bullion context, that can support demand because international buying is not driven only by U.S. investors. Still, the effect has to be read alongside yields and broader risk sentiment.
Kitco also noted that gold had been pressured by a stronger dollar. That shows the dollar can change quickly over short periods and influence gold in different ways. For that reason, readers should not treat one dollar reading as a stand-alone conclusion.
For gold, a softer dollar, high inflation, and safe-haven demand can be a supportive combination. But if yields remain high or inflation data keeps policy easing expectations restrained, that support can fade. This is the macro tug-of-war that often defines gold trading.
Higher prices do not mean no pressure
Spot gold around US$4,701.50 per ounce on May 14, 2026 shows that the market was already at a level drawing close attention. But a high price does not mean momentum is free of resistance. In fact, when prices are sensitive, every inflation, dollar, and yield release can reset expectations.
For editorial bullion coverage, it is important to separate global spot pricing from local retail pricing. The data available here comes from external sources such as Trading Economics, Kitco, FRED, and CME Group. No local physical buy-sell spread data was provided, so this article does not discuss retail spreads or product-specific premiums.
Physical-market spreads are usually influenced by product form, size, availability, taxes, distribution costs, and seller policy. Since those details were not provided, the safest and most relevant framing is the global context: spot price, inflation, interest rates, yields, the dollar, and futures activity.
Futures activity shows the market remains active
CME Group reported COMEX Gold Futures volume of 156,326 contracts and open interest of 379,133 for the trade date of May 8, 2026. These figures do not point to price direction on their own, but they do show that gold derivatives remained active and liquid.
For general readers, futures volume is a measure of trading activity in contracts. Open interest shows how many contracts are still open. Both are often used to gauge how busy and relevant a move may be, although neither should be treated as a single trading signal.
In this article’s context, CME data helps confirm that gold is not moving only because of physical buying. The global gold market is also shaped by institutional trading, futures positioning, hedging, and adjustments to economic data. That is why gold can react quickly to inflation, and then shift again when yield or dollar data moves.
Large market activity can make prices more responsive to new releases. When inflation, rates, or the dollar send different signals, market positions can be adjusted quickly. The result is that gold can move sharply even when the underlying narrative has not fully changed.
Inflation expectations add another layer
Trading Economics also reported that the University of Michigan 1-year inflation expectation fell to 4.5% in May 2026 from 4.7% in April. The 5-year inflation expectation eased to 3.4% from 3.5%. This does not remove inflation from the market agenda, but it shows that consumer expectations do not always move in the same direction as the latest annual inflation reading.
For gold, expectations matter because the market is not only judging what has already happened. It is also trying to read whether price pressure will persist, ease, or reaccelerate. If inflation expectations stay elevated, the hedge narrative remains relevant. If expectations decline, some of the inflation-driven safe-haven pressure can ease.
Readers should therefore distinguish between actual inflation data and inflation expectations. U.S. annual inflation for April 2026 rose to 3.8%, while the 1-year expectation still edged down to 4.5%. Both can be true at the same time, but they send different messages to the market.
Actual data describes the latest price conditions, while expectations reflect forward-looking perceptions. Gold usually reacts to both, while also weighing how the Federal Reserve and the bond market may respond. That is why a single inflation figure rarely explains the full move in gold.
4) Editorial takeaway
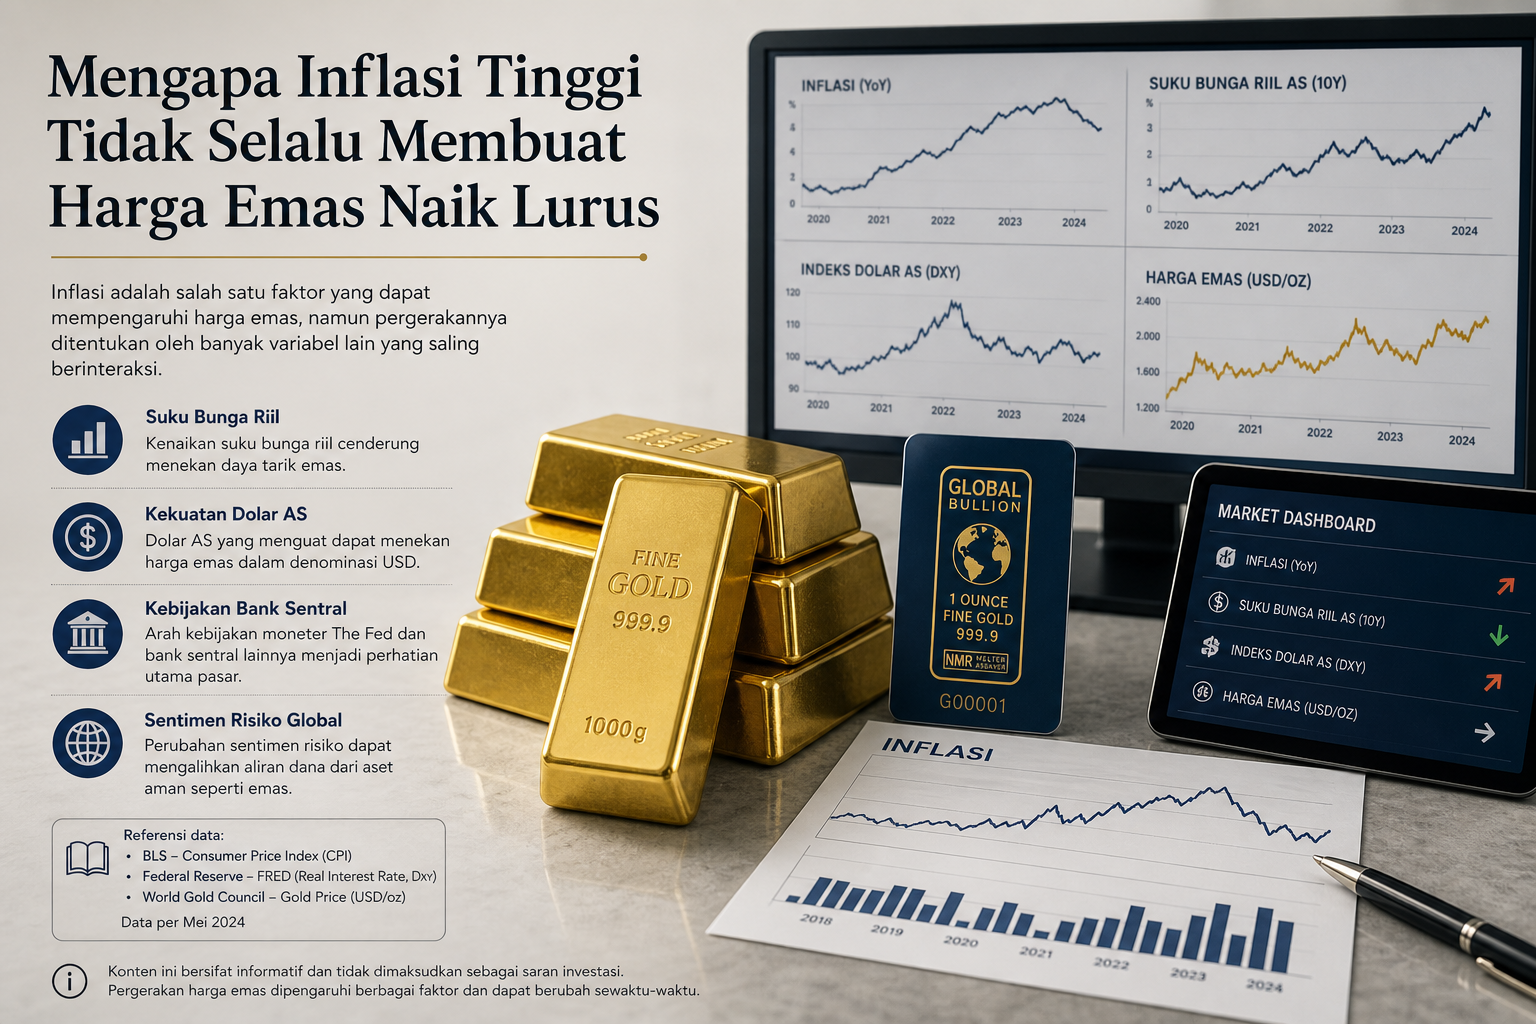
There are four main reasons high inflation does not always push gold higher without interruption. First, higher inflation can keep rates elevated, which raises the opportunity cost of holding gold. Second, attractive bond yields can compete with gold as a store-of-value choice.
Third, the U.S. dollar can strengthen or weaken inflation’s impact on gold. A weaker dollar usually helps gold for non-U.S. buyers, while a stronger dollar can apply pressure. Fourth, futures positioning can amplify short-term reactions to new data.
In other words, gold sits amid several forces at once. Inflation and geopolitical risk can support safe-haven demand. But a 3.75% policy rate, Treasury yields around 4.5%, and shifts in the dollar can keep price gains from moving in a straight line.
This matters because readers should not judge gold from a single headline. Inflation is important and relevant, but global gold pricing also absorbs monetary-policy expectations, bond-market yields, and international trading flows. Sound bullion coverage should leave room for all of those factors.
5) Reference reminder
For readers tracking gold as part of market monitoring, a more balanced approach is to look at the data together. U.S. inflation at 3.8% in April 2026 supports the hedge narrative. Spot gold around US$4,701.50 per ounce on May 14, 2026 shows a market that was already high and sensitive to news.
At the same time, the 3.75% U.S. policy rate and Treasury yields near 4.5% remain important headwinds. The weaker dollar reported by FRED can help, but dollar moves are not consistent from one day to the next. CME data also shows active gold futures trading, which means reactions to macro data can be fast.
In short, high inflation is an important factor for gold, but it is not an automatic switch for higher prices. Gold can benefit from its hedge role while still facing pressure from higher rates and yields. Reading both sides keeps bullion analysis calm, factual, and measured.
This article is for educational purposes and does not contain personal investment advice. Main references used here are Trading Economics for inflation, rates, and inflation expectations; Kitco for spot gold context; FRED at the St. Louis Fed for the dollar index; and CME Group for COMEX Gold Futures activity. Readers should always check the latest official sources because macro data and market prices can change.
References
- Trading Economics (2026). Inflasi AS April 2026 naik ke 3,8%, di atas perkiraan. Bullish secara fundamental karena inflasi yang lebih tinggi dapat meningkatkan minat emas sebagai lindung nilai, tetapi juga bisa menunda ekspektasi pemangkasan suku bunga.
- Kitco (2026). Kitco mencatat spot gold sekitar US$4.701,50 pada 14 Mei 2026. Memberi konteks harga pasar terkini: emas masih tinggi, tetapi sensitif terhadap data inflasi, arah dolar, dan yield obligasi AS.
- Trading Economics (2026). Suku bunga acuan AS masih berada di 3,75%. Cenderung menahan kenaikan emas dalam jangka pendek karena suku bunga tinggi mendukung yield aset berbunga; namun jika pasar mulai mengantisipasi pemangkasan, emas dapat kembali mendapat dorongan.
- Federal Reserve Bank of St. Louis - FRED (2026). Indeks dolar AS broad turun ke 118,0392 pada 8 Mei 2026. Bullish untuk emas jika pelemahan dolar berlanjut, karena harga bullion dalam USD menjadi relatif lebih murah bagi investor global.
- CME Group (2026). CME: volume Gold Futures COMEX mencapai 156.326 kontrak pada 8 Mei 2026. Aktivitas futures yang besar menunjukkan minat institusional dan likuiditas yang kuat, sehingga dapat memperkuat relevansi pergerakan harga emas global untuk artikel pasar.
- Trading Economics (2026). Ekspektasi inflasi 1 tahun AS turun tipis ke 4,5% pada Mei 2026. Netral hingga bullish: penurunan ekspektasi dapat mengurangi tekanan safe-haven inflasi, tetapi level yang masih tinggi tetap mendukung narasi emas sebagai hedge.