1. Lead market snapshot
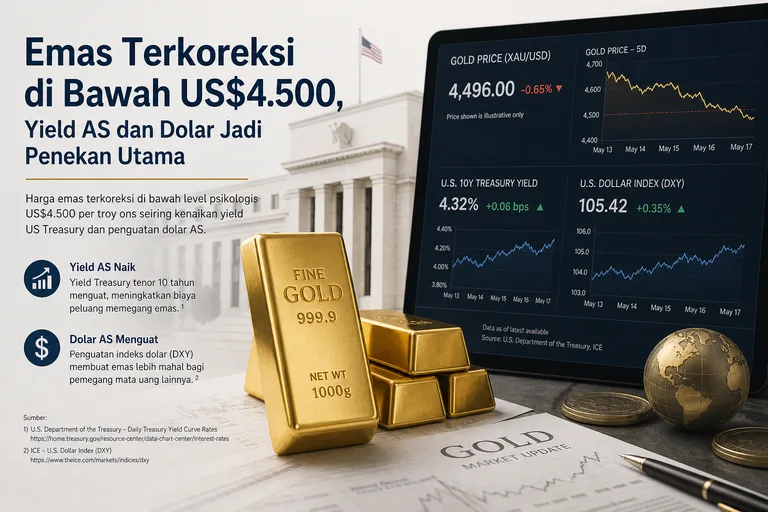
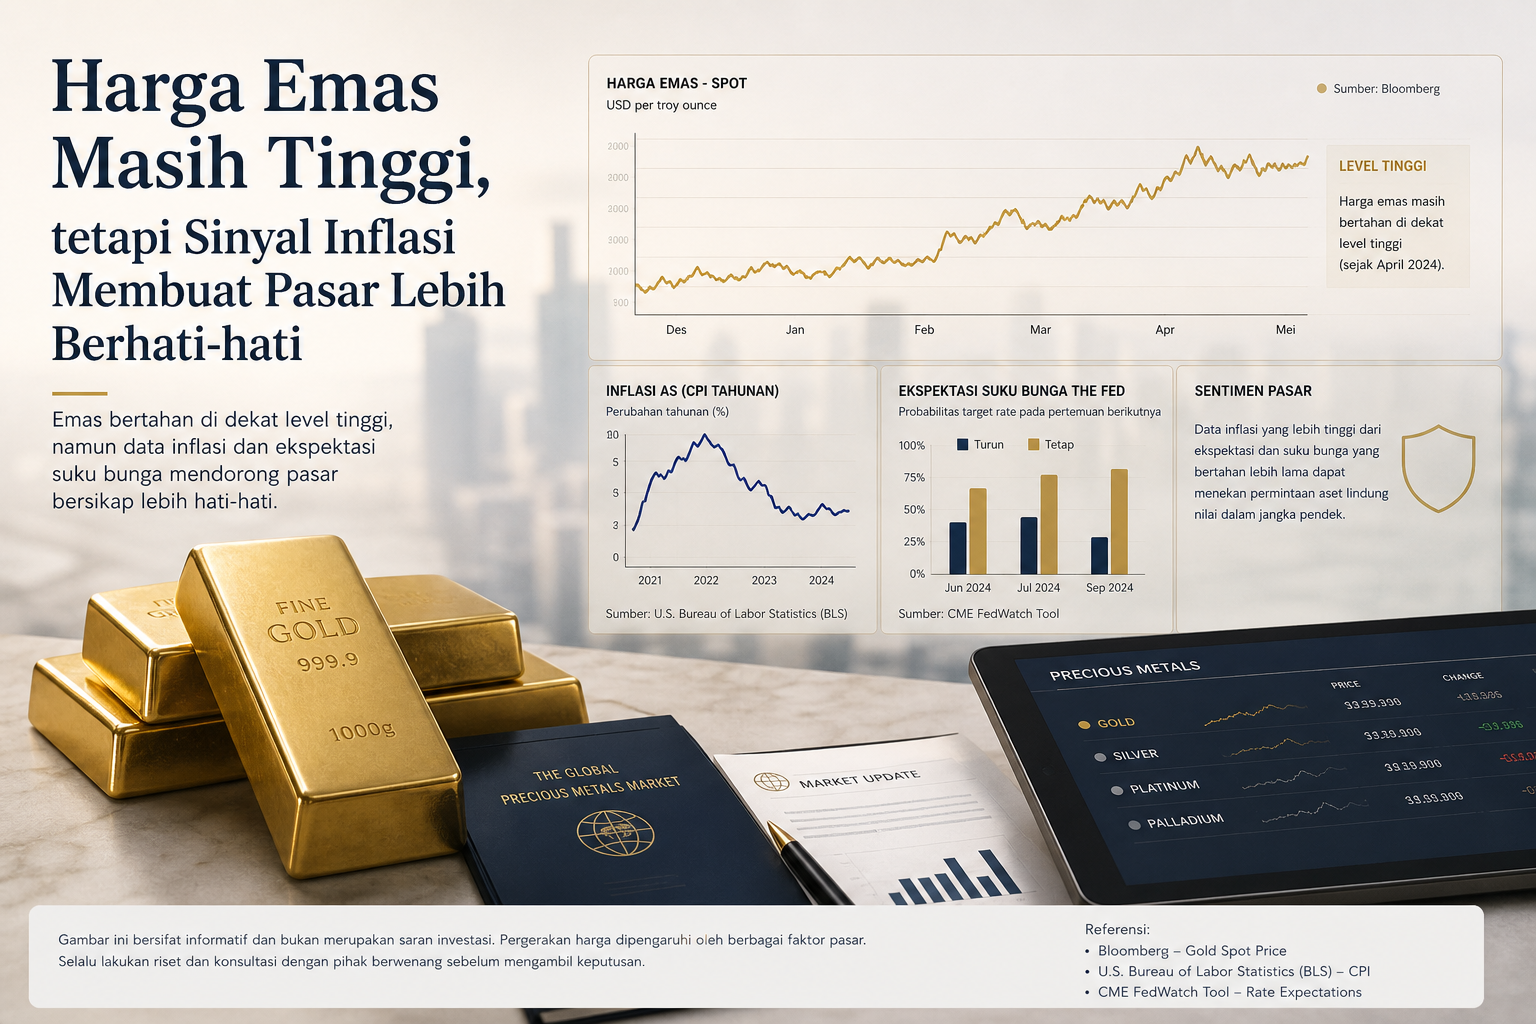
Based on the benchmark data published by the LBMA, gold remained at a high level on May 19, 2026, with the LBMA Gold Price AM at US$4,541 and the LBMA Gold Price PM at US$4,496.7. That gives a clear starting point for reading the bullion market today: gold is still strong on a price basis, but day-to-day movement is becoming more sensitive to inflation, interest rates, and the U.S. dollar.
The gap between the AM and PM LBMA prices on the same day shows that the market is not moving in a simple one-way pattern. The PM price was about US$44.3 lower than the AM price. In other words, the more accurate reading is not just that gold is up or down, but that it is holding at elevated levels while absorbing a broader macro tug-of-war.
2. Price context and spread
For bullion readers, this context matters because international benchmarks are often the first reference point before assessing local pricing, retail spreads, or other operational decisions in the physical market. However, an international benchmark does not automatically equal the transaction price in every market. Distribution costs, exchange rates, taxes, product size, and local liquidity can all push final prices away from the global reference.
3. Main movers or strongest signal
Gold is still high, but the room to move is not risk-free
The main signal this week comes from the combination of still-elevated gold prices and macro pressure from the United States. Trading Economics reported on May 13, 2026 that gold was trading below US$4,700 per ounce after two straight sessions of declines, as rising U.S. inflation strengthened expectations that the Federal Reserve could keep rates higher for longer, or even raise them further.
For gold, interest rates are not just background noise. Gold does not pay a coupon or interest, so higher rate expectations can raise the opportunity cost of holding bullion. When yield-bearing assets look more attractive, some market participants usually become more cautious about non-yielding assets such as gold, especially after a large price run.
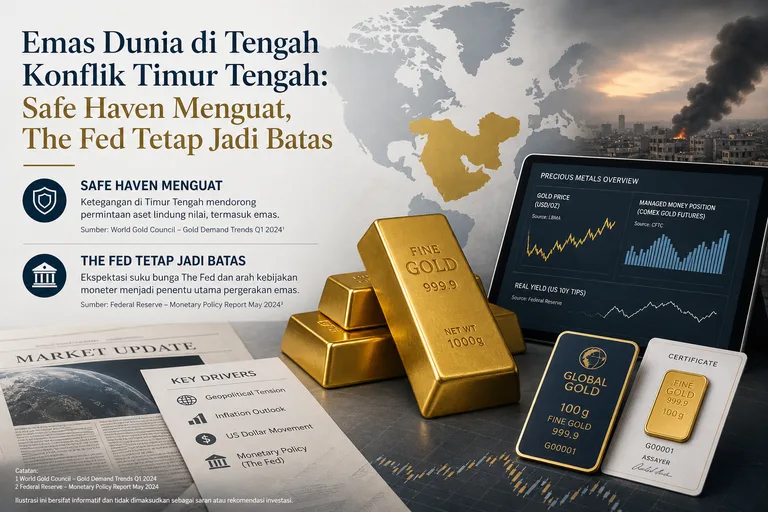
At the same time, rate pressure does not erase gold’s role as a hedge. Data and commentary from CME Group in its Q2 2026 Metals Update noted that gold’s rally continued from the first quarter, with prices holding around US$4,800 per ounce in April after peaking in January. CME also highlighted that central banks remain in buying mode, which can provide a structural floor for gold in the context of portfolio diversification and geopolitical shifts.
These two signals create a more balanced market picture. On the structural-demand side, gold is still supported by central-bank buying, diversification, and portfolio-stabilization needs. On the near-term macro side, U.S. inflation and Federal Reserve rate expectations can cap upside, especially if the market begins to think tighter policy will last longer.
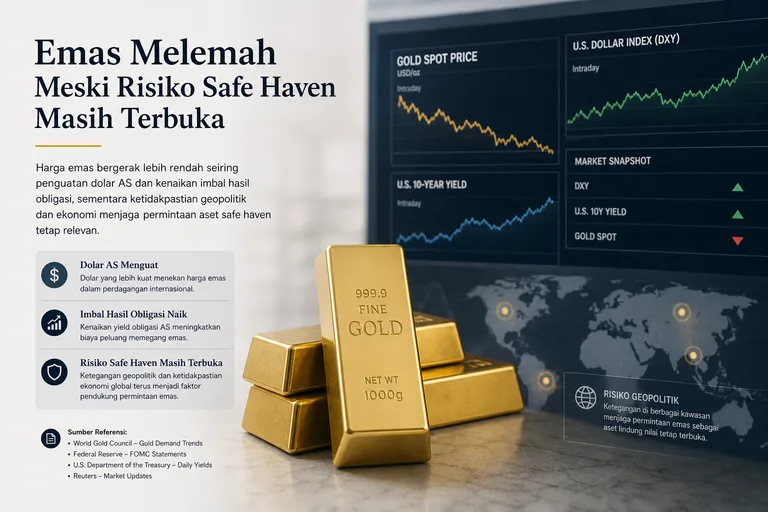
The U.S. dollar also shapes price sensitivity
Beyond inflation and rates, the U.S. dollar remains a key variable. Data from the Federal Reserve Bank of St. Louis via FRED shows the Nominal Broad U.S. Dollar Index at 118.3926 on May 1, 2026. Because gold is traded globally in U.S. dollars, the dollar’s direction can affect purchasing power for non-U.S. buyers and the relative price perception of gold across currencies.
In general, a stronger dollar can limit gold’s upside for buyers outside the United States. When the dollar strengthens, gold in local currency terms can feel more expensive, which may make certain pockets of demand more selective. Conversely, a weaker dollar can make gold easier to buy in other currencies and may support interest in bullion.
That said, the gold-dollar relationship is not always mechanical. During periods of uncertainty, both gold and the dollar can be sought after because they play different roles in the global financial system. For that reason, overly simple readings of the inverse gold-dollar relationship should be avoided, especially when the market is also weighing inflation, bond yields, and geopolitical risk.
FRED also updated the 10-year U.S. Treasury yield series on May 20, 2026. While the specific yield level is not included in the available source summary, the series remains relevant as an indicator of gold’s opportunity cost. Higher yields tend to weigh on gold, while lower yields usually support bullion because the cost of holding gold is reduced.
Silver provides a useful comparison within precious metals
The LBMA also recorded the LBMA Silver Price at US$76.040 on May 19, 2026. This shows that gold is not the only metal in focus; silver is also part of the broader precious-metals picture. In bullion coverage, silver is often an important comparator because its movement can reflect a mix of investment demand and industrial use.
An LBMA Alchemist article on the 2026 precious-metals forecast survey said the precious-metals market entered 2026 with strong momentum, but also with rising risks. In that same source, geopolitical tensions were said to reinforce gold’s safe-haven role, while analysts projected an average silver price for 2026 of US$79.57, up 98% from the actual 2025 average price.
That should not be read as a guarantee of direction. What matters more for readers is that the precious-metals market is operating in a strong but volatile environment. Large moves can coexist with sharp corrections, especially when positioning is crowded or when macro data changes rate expectations.
This is also why gold cannot be read properly from a single spot price or a single daily headline. Gold is being influenced by several layers at once: the elevated LBMA benchmark, Trading Economics’ note on inflation and Fed expectations, CME’s view of central-bank support, and FRED data on the dollar and Treasury yields. Each of those factors can move differently over the same time frame.
For the Indonesian market, this global context still matters because local gold prices are heavily influenced by international prices and exchange rates. Although this article does not use internal price lists or specific retail quotations, readers can understand that global moves are usually one of the main inputs into domestic pricing. At the same time, local prices can still differ because of costs, supply conditions, and each seller’s policy.
4. Editorial takeaway
On sentiment, the market is closer to a cautious mode. Gold remains high and safe-haven support is still visible, but pressure from U.S. inflation and expectations of higher rates for longer means the near-term upside is not free of obstacles. In other words, the market has not lost its reason to hold gold, but it has also not received a clean enough signal to ignore correction risk.
The editorial takeaway is straightforward: gold remains in a strong position according to the latest public benchmark, but the quality of the rally needs to be read together with macro data. If U.S. inflation stays in focus and the Federal Reserve is expected to keep policy tight, gold may become more sensitive to the next round of economic releases. On the other hand, central-bank buying, portfolio diversification, and safe-haven demand remain supportive forces that make bullion difficult to judge from just one variable.
For readers, the healthiest approach is to separate price facts, market drivers, and interpretation. Price facts come from benchmarks such as the LBMA. Market drivers include inflation, interest rates, the U.S. dollar, Treasury yields, and central-bank demand. Interpretation should be handled carefully, because precious-metals markets can shift quickly when new data arrives.
5. Reference reminder
This article is not intended as personal investment advice. The main references used here are the LBMA for gold and silver benchmarks on May 19, 2026, Trading Economics for the U.S. inflation and Federal Reserve context on May 13, 2026, CME Group for second-quarter 2026 metals-market commentary, and FRED from the Federal Reserve Bank of St. Louis for U.S. dollar and Treasury yield indicators. Any follow-up reading should continue to rely on official sources and the latest market data so the price context stays accurate.
References
- LBMA (2026). LBMA benchmark shows gold and silver remain at elevated market levels. Supports an editorial angle that bullion prices remain historically elevated, making price sensitivity, profit-taking, and safe-haven demand key themes.
- Trading Economics (2026). Gold pressured by inflation-driven higher-for-longer Fed expectations. Higher rate expectations raise the opportunity cost of holding non-yielding gold, creating short-term headwinds even when safe-haven demand remains present.
- CME Group (2026). CME notes gold rally supported by central banks and portfolio diversification. Reinforces a constructive medium-term gold narrative based on official-sector demand, diversification, and geopolitical hedging.
- Federal Reserve Bank of St. Louis / FRED (2026). U.S. dollar index data remains a key cross-market signal for gold. A stronger dollar can cap gold upside for non-U.S. buyers, while dollar weakness can amplify bullion demand and local-currency gold gains.
- LBMA (2026). LBMA 2026 analyst forecasts emphasize volatility, safe-haven demand, and silver strength. Useful for an editorial angle warning that bullish precious-metals fundamentals can coexist with sharp pullbacks and elevated volatility.
- Federal Reserve Bank of St. Louis / FRED (2026). U.S. 10-year Treasury yield remains central to gold’s opportunity-cost narrative. Elevated yields may pressure gold, while falling yields would typically support bullion by lowering the opportunity cost of holding it.