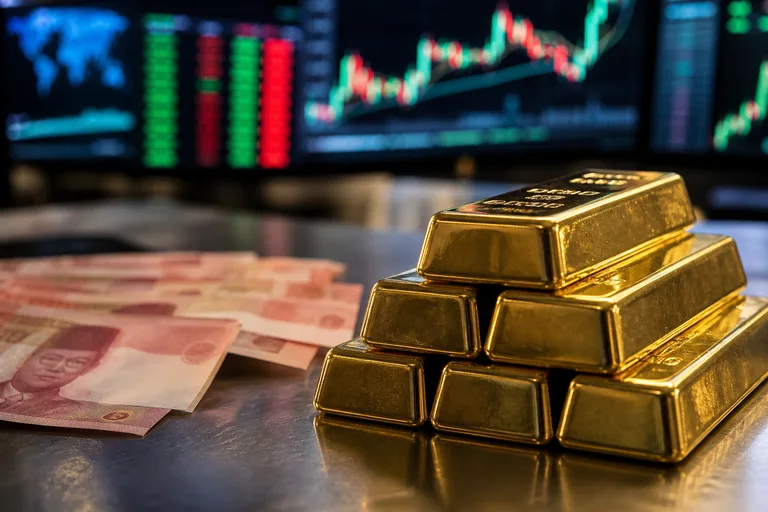
1. Market snapshot
According to the World Gold Council, central banks recorded net gold purchases of 244 tons in the first quarter of 2026. That was 17% higher than the previous quarter and above the five-year average, making it one of the clearest signals in current global gold demand.
The same report showed that total global gold demand, including OTC transactions, reached 1,231 tons in Q1 2026. On a yearly basis, volume rose 2%, while quarterly demand value jumped 74% to a record US$193 billion.
2. Price context and spread
This article does not use internal price feeds, ERP snapshots, or closed retail pricing data. The public source used here focuses on global demand and macro indicators, so price context is read through demand value, central bank buying, inflation, and interest rates.
The reported US$193 billion in quarterly demand helps show that the gold market remains large even when higher prices may affect some buyers. The faster rise in value than in volume suggests that market interest is being reflected more in transaction value than in tonnage alone.
No public buy-sell spread data was provided in the source. For that reason, this article does not publish a spread figure. Readers comparing local pricing should still separate global market data from product premiums, taxes, distribution costs, and seller policy.
3. Main mover or strongest signal
The most notable signal is the continued buying by the official sector. The World Gold Council said central bank demand remains supported by geo-economic uncertainty and reserve diversification. In other words, gold continues to be treated as part of reserve strategy, not just as a short-term sentiment trade.
Central bank buying of 244 tons matters because these institutions typically operate on longer policy horizons. They do not assess gold the way retail investors do on a day-to-day price basis. Adding gold reserves is more often tied to balance sheet stability, reserve diversification, and external risk management.
Physical investment demand also reinforced that picture. The World Gold Council reported that bar and coin demand rose 42% year on year to 474 tons in Q1 2026, with Asian investors among the key drivers. That shows demand is coming not only from central banks, but also from physical buyers who tend to behave more like long-term value preservers.
Still, strong physical demand does not automatically translate into a one-way price move. Gold prices also respond to interest rates, the U.S. dollar, and inflation expectations. One demand report alone is not enough to define the market direction.
4. Editorial takeaway
The main message from the latest data is that central banks remain an important support for the case for gold as a reserve asset. Net buying of 244 tons in Q1 2026, together with stronger bar and coin demand, suggests that interest in physical gold remains intact in a period of uncertainty.
At the same time, the broader macro backdrop remains balanced rather than one-sided. U.S. inflation is still present, the Federal Reserve has kept rates positive, and Bank Indonesia has raised its policy rate. These factors can affect both sentiment and pricing.
For readers following the precious metals market, the takeaway is to read the data as a combination of signals rather than a single conclusion. The World Gold Council provides the demand side, while the U.S. Bureau of Labor Statistics, the Federal Reserve, Bank Indonesia, and Indonesia’s statistics agency help place gold in a wider macro context.
This article is not personal investment advice. It is intended to help readers understand the market based on publicly available data. Any decision to buy, sell, or hold gold should take into account personal needs, time horizon, costs, liquidity, and risk profile.
5. Reference reminder
- World Gold Council, Gold Demand Trends Q1 2026, published 29 April 2026.
- World Gold Council, Q1 2026 central bank gold buying report, published 29 April 2026.
- U.S. Bureau of Labor Statistics, April 2026 CPI report, published 12 May 2026.
- Federal Reserve, monetary policy implementation note, 29 April 2026.
- Bank Indonesia, BI-Rate announcement, 20 May 2026.
- Statistics Indonesia (BPS), April 2026 inflation release, published 4 May 2026.
References
- World Gold Council (2026). World Gold Council: Q1 2026 gold demand value hit record US$193bn. Bullish for bullion narrative: strong physical investment demand and record demand value support an editorial angle that gold remains attractive despite high prices.
- World Gold Council (2026). Central banks added 244 tonnes of gold in Q1 2026. Bullish: persistent central-bank buying strengthens gold's safe-haven and reserve-asset story, useful for explaining why bullion demand can stay firm during uncertainty.
- U.S. Bureau of Labor Statistics (2026). BLS: U.S. CPI rose 0.6% in April; annual inflation accelerated to 3.8%. Mixed-to-bullish: sticky U.S. inflation can support gold as an inflation hedge, but it may also keep Fed rates elevated, increasing the opportunity cost of holding non-yielding bullion.
- Bank Indonesia (2026). Bank Indonesia raised BI-Rate by 50 bps to 5.25% on May 20, 2026. Important for Indonesian bullion context: tighter BI policy may support rupiah stability, which can affect local gold prices in rupiah even when global spot prices move.
- Badan Pusat Statistik (2026). BPS: Indonesia April 2026 inflation at 2.42% y/y; gold jewellery influenced core inflation. Bullion-relevant for local readers: jewellery-gold price movements are visible in Indonesia's inflation basket, making domestic CPI a useful hook for articles on gold purchasing power and consumer demand.
- Federal Reserve (2026). Federal Reserve kept federal funds target at 3.50%-3.75% after April FOMC. Neutral-to-bearish via opportunity cost: a still-positive U.S. policy-rate backdrop may cap gold upside, especially if the dollar strengthens or real yields remain elevated.